Maps of the war in Ukraine – and we know a good number of such tools from the ISW interactive map to liveuamap.com, deepstatemap.live and more – are typically not considered synthetic images in the same sense as computer-generated simulations or visualizations as they are based on real-world geographic data, satellite imagery, intelligence reports, and other sources of information.
However, as they promise to provide an accurate representation of the war’s dynamics by mutual augmentation to increase the overall value or quality of an interactive map, these maps constitute a particular type of operational synthetic images. The use of AI technology also impacts the capabilities of interactive maps of war by automating data analysis and providing personalized user experiences.
Thus, these maps serve as cognitive tools for relating to and understanding the evolving situation on the ground, including territorial control, troop movements, and key strategic locations. Despite the promise, the dynamic maps posit significant challenges in terms of data accuracy and reliability, security concerns, misinterpretation and bias, lack of context, technical limitations, and ethical considerations. This presentation will discuss the synthetic nature of dynamic maps in terms of their truth-value, evidential capacity, and surplus value of augmented data.
Read full transcript (generated by Whisper)
I'm going to introduce our first speaker now. Svitlana Matvienko is associate professor of critical media analysis in the School of Communication of Simon Fraser University. She is associate director of the Digital Democracies Institute. Her research and teaching are focused on information, cyber war, media and environment, psychoanalysis, infrastructure studies and history of science. Her current work investigates nuclear terror, weaponization of pollution and technogenicization. She has co-edited two collections, the Imaginary App with MIT Press 2014 and Lacan of the Most Human in 2018. She's a co-author of Cyber War and Revolution, Minnesota University Press 2019. She won the 2019 Book Award of the Science, Technology and Information Science Award. She is a professor of digital technology at the University of She is a professor of digital technology at the University of Minnesota. She is a professor of art in international relations section of the International Studies Association and the Canadian Communication Association Book Prize. Thank you, Hida. Thank you, Francis. Thank you, everyone who is here. Okay, so my presentation is focused on synthetic images, which are the maps of war. So drones are not the focus. They are not the focus of the book. They are the maps of war.
The에서 priority посыл в наше доказание. These maps are not the primary focus of my presentation, but they are a core element of how the synthetic image the map of war how they are generated, how they are composed and how they actually act as operational images. So maps of the war in Ukraine and we know a good number of these maps. good. 136 00m 00m 35 00m 40 00m 46 00mur demanded 00m 43 00m 47 00m 44 00m 58 00m 57 00m 39 00m Des 키н 00m 51 YouTube Studies of War Interactive Map to liveurmap.com and more are typically not considered synthetic images in the same sense as computer-generated simulations or visualizations because these images are based on real-world geographic data, satellite imagery, intelligence report, and other sources of information that are not entirely synthetic. The interface of these maps may look similar to you. They promise to provide a special and temporal representation of the big events like war, but the function of some of these maps exceeds such promise. And here I again refer back to Faroqui, and not just his but much cited observation offered in the early 2000s. When by exploring the relation between humans, machines, and modern warfare, he announced the advent of a new visual regime and simultaneously a new stage in history of machine vision where the machines have started to see for themselves.
When the point of view footage from the laser-guided bombs, popularly known as smart bombs, was widely broadcasted to TV audiences. According to Faroqui, the status of images changed in the realm of intelligent machines. As byproducts of machine vision, they do not represent an object but rather a part of an operation. The machine vision is a part of the machine vision. Thus conceived as odd Cecil Hoyle reads Faroqui, operative images are usually images, working utility images, working images that typically serve practical purposes tied to specialized tasks. In the context of the war in Ukraine, these maps, I argue, as they function during the war in Ukraine, constitute a particular way of understanding the world. The world is a place of the human mind. U.S. and U.S. later emergence of the citing czyli the end loan will include also intense. The Poss connection required a war volume that inspired so-called volumetric turn across various fields and areas studies. encouraged rethinking geography in terms of volumes rather than areas. Thinking with volumes, according to Elden, extends beyond the mere addition of a vertical axis. So in this sense, when we imagine, so of course, the maps of war flatten the whole picture, right? So it's again, it comes to the map, but we are very aware of the presence of the drone vision, so-called drone vision that constitutes what this mapped volumetric terrain. Here's also a very interesting point, which I haven't had enough time to think about, but of course, I just note by passing that drones are not only technologies that constitute, the top of this volumetric kind of sphere. We know the presence of Maxar technology, Google, and all sorts of things that also can map from above. However, drones are particular here because they constitute a really movable and dynamic kind of, we could say, part of that gaze,
which is also based on the connection with the soldier. So drones, are those, you know, top point, which is cybernetically connected with the soldier. So I need probably, so this part of my thinking is not very developed, but maybe we can all think about it in questions, etc. But here I will proceed to the maps. So again, in the context of war in Ukraine, these maps function as operational synthetic images. And the map is a very, very, very, very, very, very, very, very, very, very, very, very, very, very, very, very, very, very, the most popular interactive map of Ukraine's war is the Deep State Map Live. It is often cited by domestic and international war commentators, as well as governmental officials in Ukraine. And it is used by the state emergency service of Ukraine, medical services, and the military. Indeed, incredibly reliable and source for understanding and conducting war operations. The map is an open source intelligence interactive online map of the military operations of the Russian and Ukrainian armies during the current war. But it was created by the non-international military and military operations of the Russian and Ukrainian armies and the non-international military operations of the Russian and Ukrainian armies during the current war.
The map is a multi-governmental, voluntarily led organization, Deep State UR, initially consisting of two Ukrainian programmers, Roman Pohorily and Ruslan Mykula. And this is typical for Ukraine, where the most, if not all, major operational synthetic maps and systems, such as the defense mapping software Kro-Viva, the situational awareness system Delta, the arterial altimeter , the artillery management system Arta, and other similar tools used on the battlefield, are developed by civilian volunteers and NGOs, even if eventually they usually find support from the state and the military, which makes the software assemblages of Ukrainian network-centric warfare rather decentralized. The map is a non-international, entirely decentralized, and essentially functional multi-governmental, concretely centralized, enterprises where the system is specialized, crowdsourced and crowdfunded, like the Ukraine drone army itself. When the organization Deep State UR was created in February 2020, it focused on informing the public via a telegram channel about so-called big events, such as the COVID-19 pandemic, the war in George Floyd protests and the second Nagorno-Karabakh war. They were looking into potential correlation between big events. One of the founders says, for example, how and if the events in Karabakh may or may not impact the events in Transnistria.
The 2021 Taliban offensive became the first case for the programmers' attempt at mapping the event by adding the changes as it was unfolding. In the months prior to the big-scale invasion of Ukraine, the team's next big event was the Russian build-up in troops along the border with Ukraine that could have been a sign of impending war. And the programmers were tracking the transfer of Russian military. equipment and personnel from different regions of Russia to the Ukrainian border. And on February 24, 2022, they launched a separate project solely dedicated to the war in Ukraine to reflect the current situation on the frontline and in military formations by meticulously updating the map. As of now, the Taliban have been working on the map for the first time in a decade. As of now, the Taliban have been working on the map for the first time in a decade. As of now, the Taliban have been working on the map for the first time in a decade. As of now, the map identifies different territories, entities, vectors, and dimensions. The territory of Ukraine that the armed forces of Ukraine liberated during the two last weeks. Liberated territory of Ukraine in general.
The territory about which information needs to be clarified. The territory of Ukraine temporarily captured by the enemy. The territory of Ukraine temporarily captured by the enemy. The territory of Ukraine temporarily captured by the enemy. The city of Ukraine閹k bratank, whose home land is worked on by the enemy, may again begin to dein crafts with, Intangible Intelligence. The territory of Ukraine temporarily captured by the enemy. The territory of Ukraine temporarily captured by the enemy. In this case, theинг-branκεs are étaient какие конверt Christmas community. In this case, theKüsa-Wie من pieces of Larry Land have settled in the area of Charru Tai Lwów Chur, wall of Kimberley sharp-roe Howard Epöhhh. The territory of Ukraine temporarily captured by the enemy. subsequent move to marry America The outer share of the tuttees of Moscow is occupied territory, the scene in which the house of president Vladimir Zelensky stands. Pohorili and Mikula developed DeepState using Google Maps as a backdrop. But one month after the launch, Google unsurprisingly blocked DeepState UA's use of their Google Map for violation of the rules of service. Instead of Google Maps, now the map layer is made of MapTiler, a global map service provider and software development company which supplies the maps both raster data and vector data.
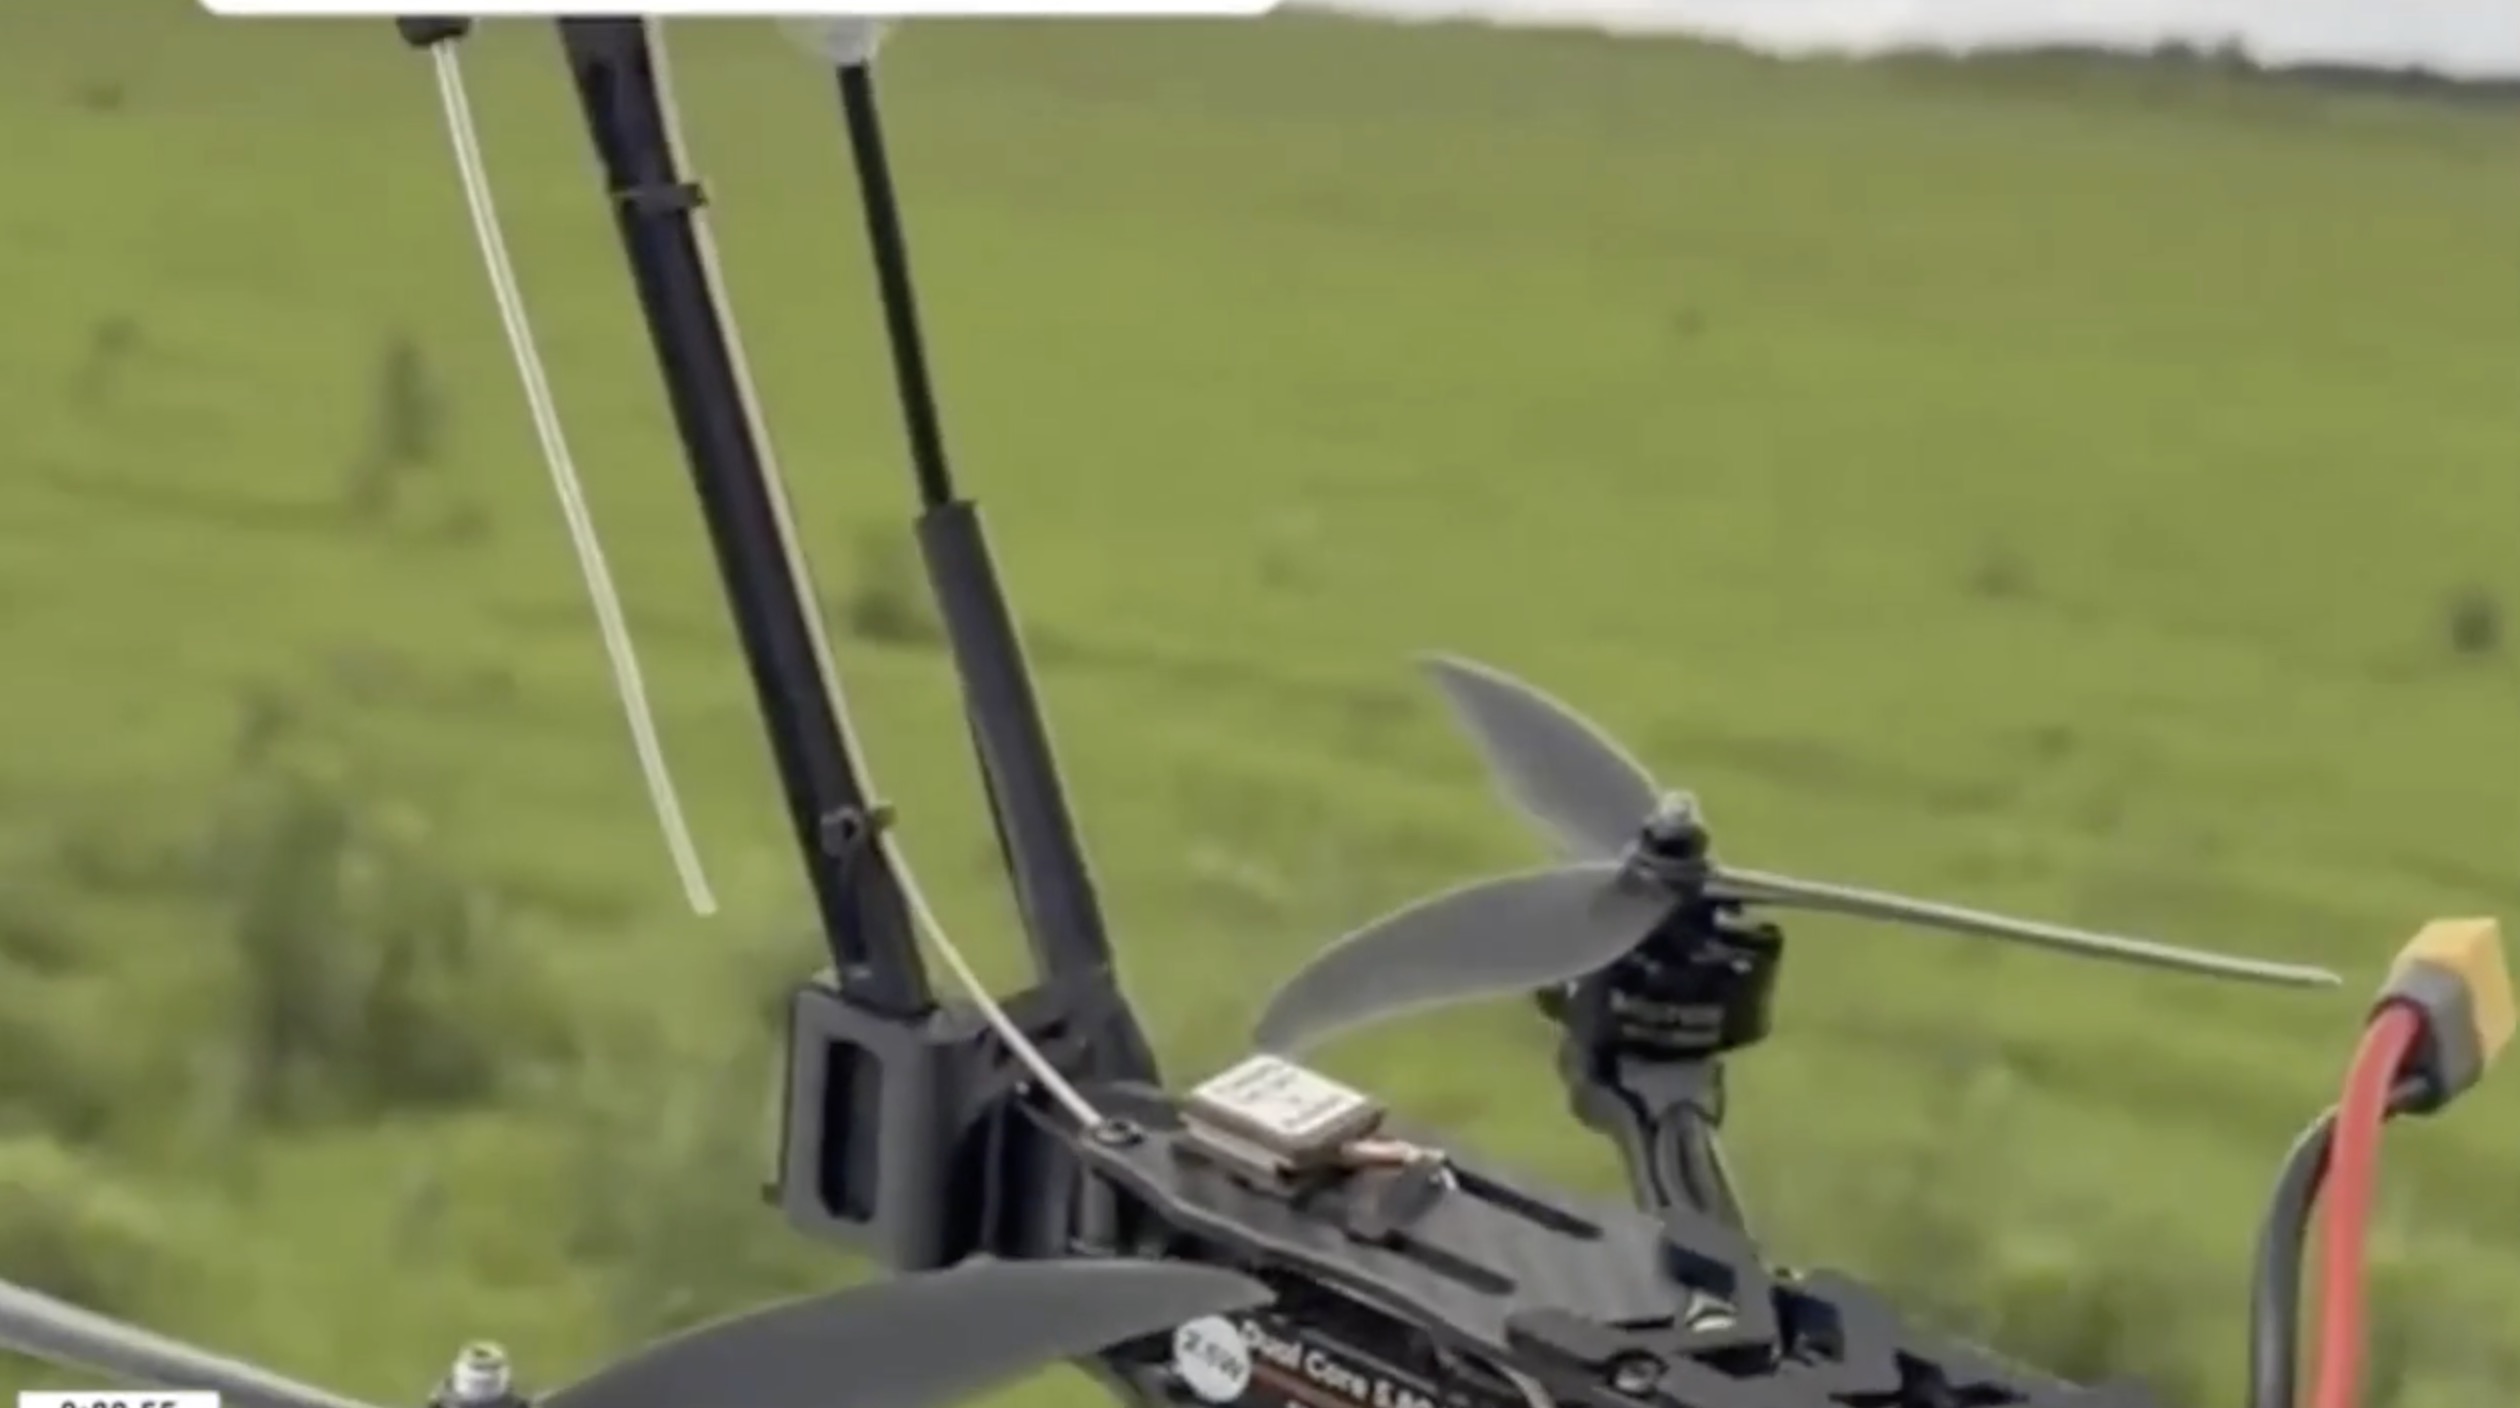
It works by moderators capturing data, often it's geolocated photos and videos, all those operational images that, according to Farocki, see themselves, published interceptions, the data from other software. It's also used to track the data of social media, Twitter, Facebook, or banned in Ukraine, Одноклассники, as well as insights from trusted channels, followers who are located near the frontline, who get in touch with the team, so people literally get in touch with the team, and the Ukrainian military as well as another source. And all of this data, is cross-checked according to the map managers, and as well they use the techniques, and all of them kind of is brought together, processed, cross-checked, and analyzed and put on the map. So at some point it was done quite quickly, and it was not done manually, and therefore a real assemblage was very difficult to achieve until they started using Griselda. So visualization of enemy concentration is processed by the neural network of the Griselda system, one of the core technologies in Ukrainian intelligence data fusion architecture, developed in the first century of the Soviet Union. And it was developed in the first three months of the invasion by, again, civilian programmers Alex Tiplukhin and Dmytro Shamrai, currently cooperating with several units of the special operation forces and armed forces, security forces and Ministry of Defense of Ukraine.
Griselda combines ground-level photos, drone photos, footage, and site imagery to produce strategic and tactical intelligence advantages, by processing a large flow of intelligence information coming from various sources, such as low-Earth orbit satellites, drones, social networks, media, and hacked enemy databases. It is reported to take as little as 28 seconds from the time the information appears in the system to the time it is processed, after which a kamikaze drone is launched. Griselda accumulates various data flows that in the end constitute military intelligence, imagery intelligence, such as the pictorial data collected by satellites or cameras of any kind, signal intelligence or signals of all kinds, or enemy communication interception, human data provided by man-made intelligence, or man and woman on any side of the frontline, agents and civilians on the occupied territory, open-source intelligence collected from social media or any other Internet website, cyber intelligence, penetration of enemy databases. The system's work across all these flows of data gives dimensionality of each kind of intelligence, creators explain, as the system automatically processes and integrates data. It's all available data of what is happening on the ground of any given location, which altogether demonstrates the increased capability of AI system to integrate and cross-reference data from various sources.
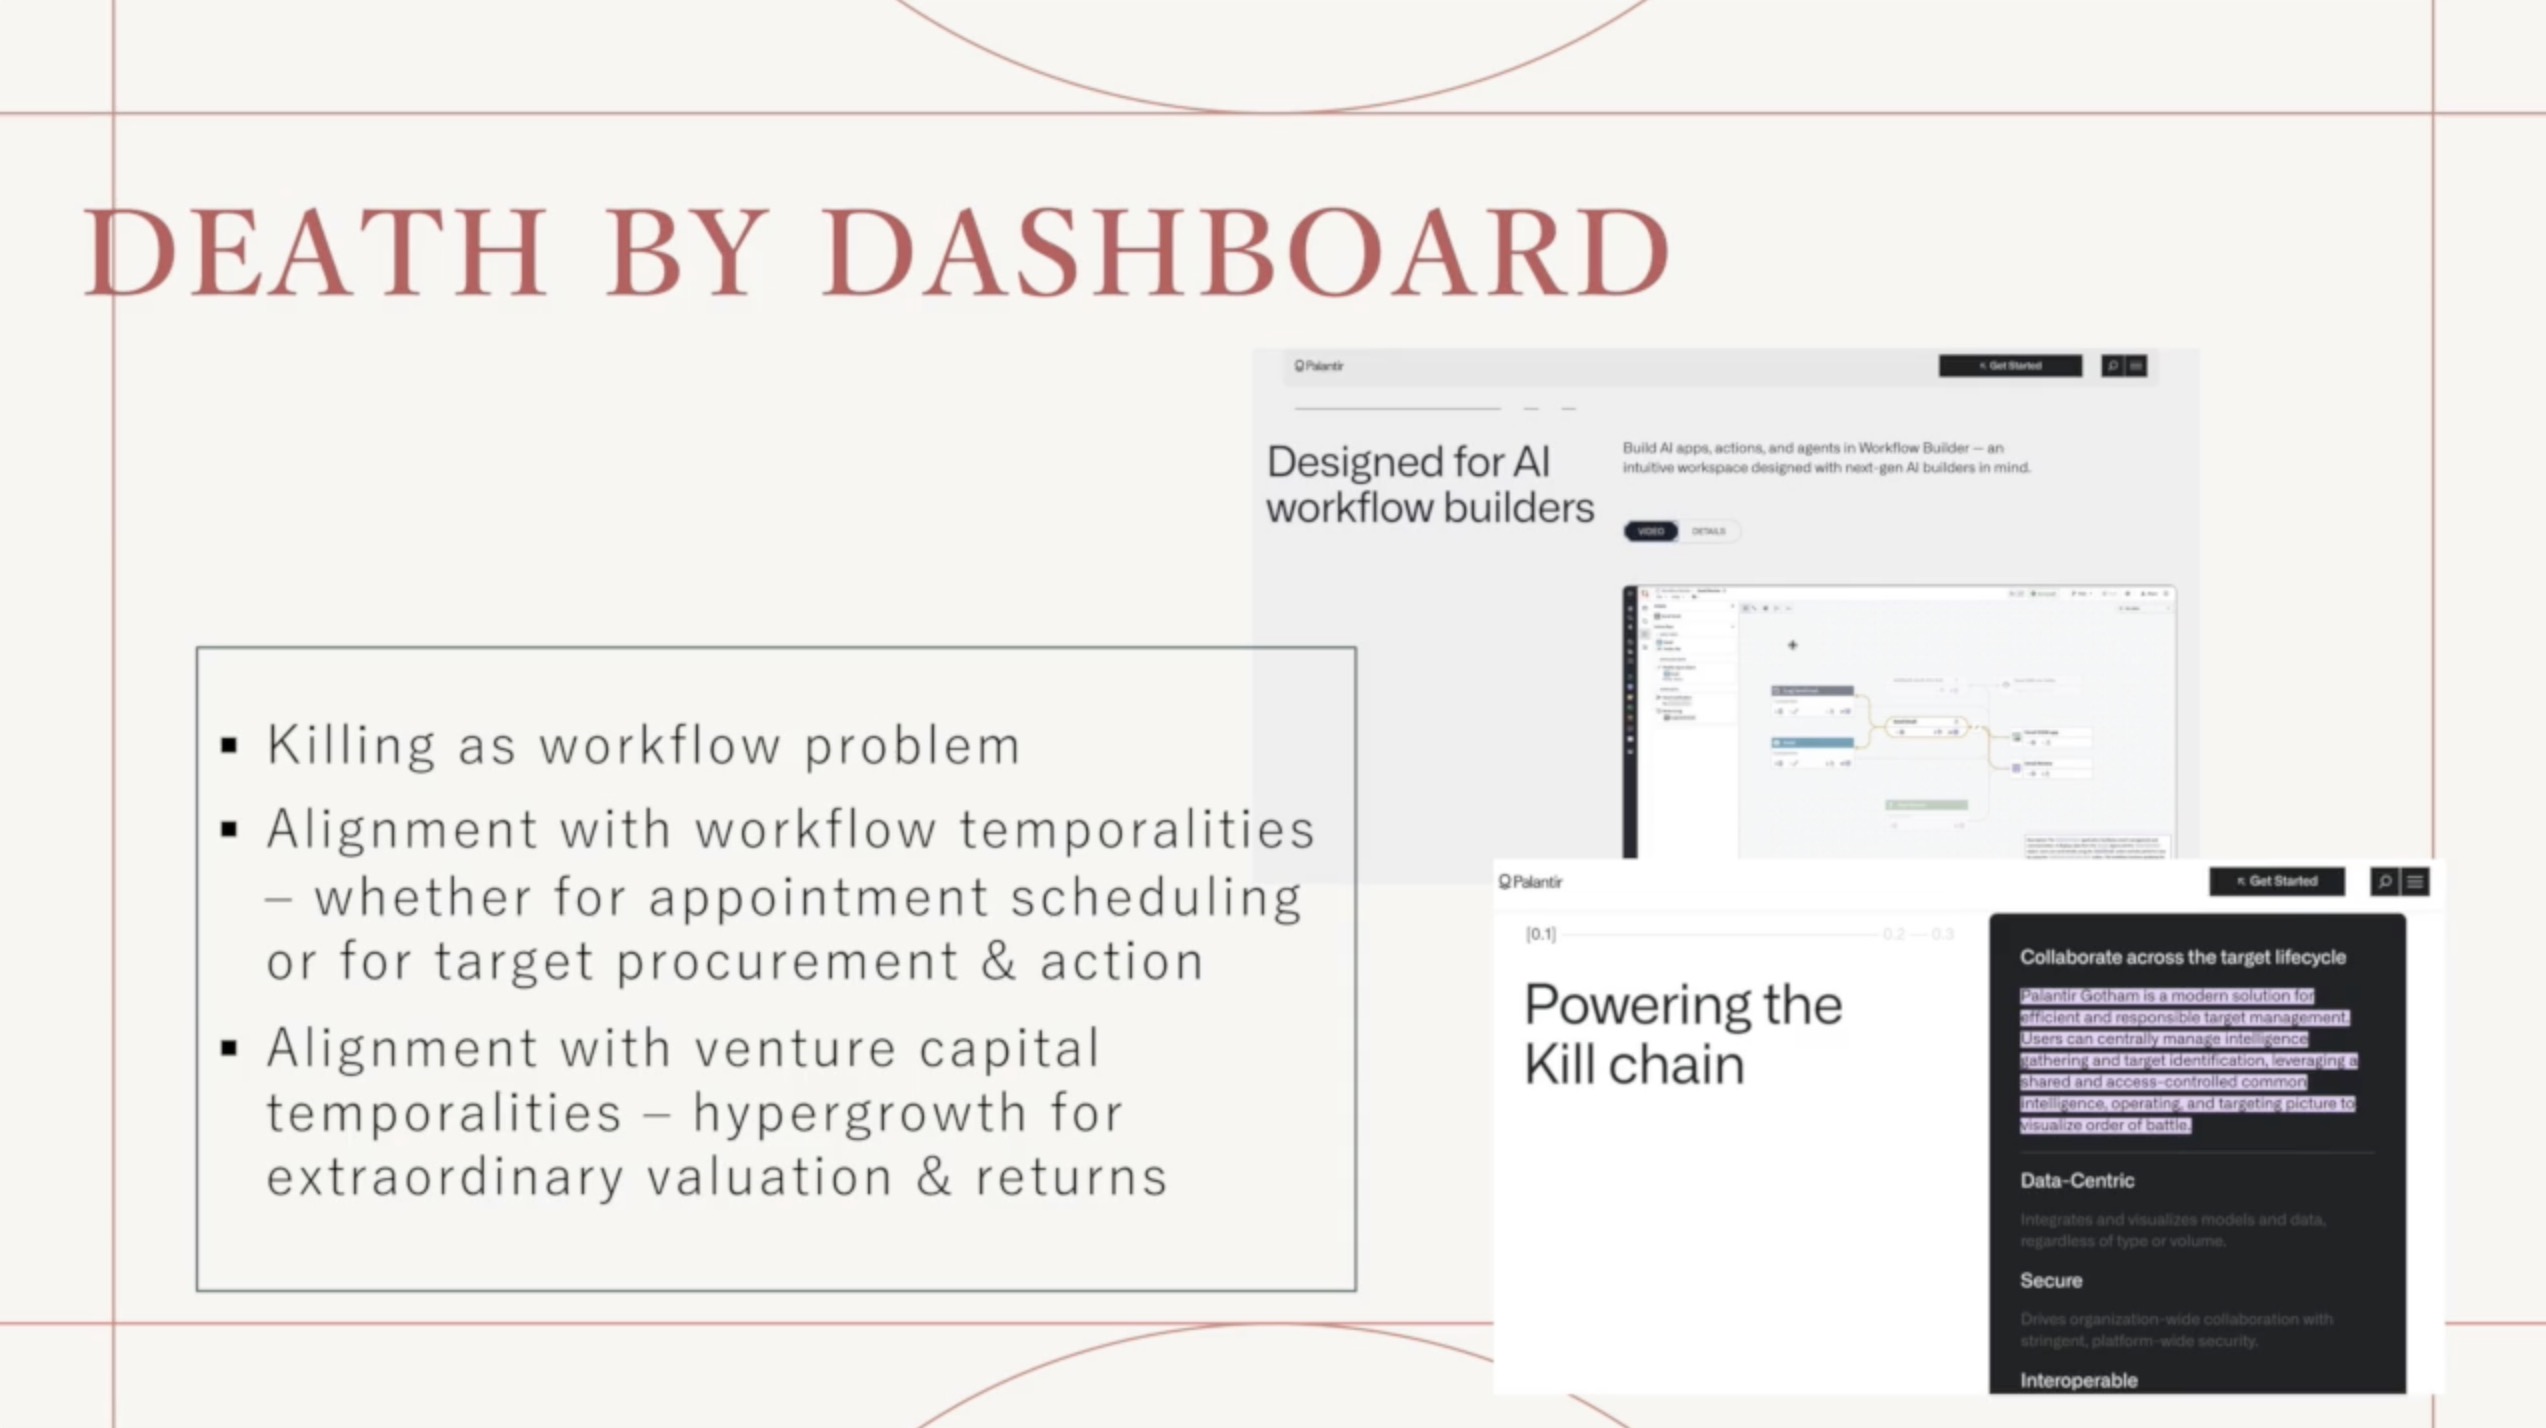
Ukraine is often referred as a living lab of AI warfare, but obviously it's not the only one. Ukraine is often referred as a living lab of AI warfare, but obviously it's not the only one. A real polygon where big companies observe their technology in action that they cannot simulate otherwise. Here, companies and governments are able to constantly train and test AI system for a wide range of capabilities, functionalities, and applications. Palantir Technologies, for example, provided its AI software to analyze troops movements, conduct battlefield damage assessment, and predict the overall development of the war. Planet Labs' BlackSky technology and Maxar technologies are also constantly producing satellite imagery about the conflict. On the slide, we see a satellite Maxar image that shows southern end of the war. The satellite image shows the movement of convoy armor towards artillery trucks east of Antonov airport in Ukraine on February 28, 2022. Here, I also want to engage with Hito's interesting theoretical proposition, proposal, and term of poor image. So, Hito's image is a very interesting theoretical proposition, proposal, and term of poor image. Here, I'd like to suggest that what we see with this combination of images is no longer a poor image or just a proper copy in motion.
As Hito described it, the online image in 2009, the image re-edited and compressed for the purposes of fast translation. Even if they lose quality of the image, Hito suggests, they gain speed and value because of the number of people who are acting upon it, who are literally operationalized by these images by war surveillance. Today, I would suggest when a poor image has currently become supremely vulnerable, supremely better, it is still no longer about the real thing, the original. Instead, it is about its own real condition of existence. It is about swarm circulation, digital dispersion, fractured and flexible. In short, it is about reality. The dynamic maps of war as complex assemblages are about reality, not in the sense of representing it, but in the sense of shaping it by incorporating flows of AI-processed data in the map's design. So, in a certain way, it's about the reality. In a certain way, it's really an assemblage of a variety of poor images. And then I think it's very interesting to think about this so-called metaphorical quality, if indeed we mean quality in this sense. But what does it, you know, like how can we reinterpret this participation of poor image in construction of this, you know, let's say, image?
You know, let's say, very complex maps of war? Because they do rely on a variety of images, many of which are exactly those poor images. The time of the deep state maps launch, immediately after the full-scale invasion coincided with a fast and multisectoral anonymization of the map. And so, it's a very interesting thing to think about. theרה oliga nemironivachuk, and its online representation. While the former tactic of removing or altering road signs to confuse invaders has been used throughout modern wars, the latter is relatively new. On Saturday, February 26, 2022, Ukraine's Ministry of Defense encouraged citizens to confuse and disorient the enemy who is illegally moving through Ukrainian territory by removing street signs or signs with the names of cities and villages. Ukrainian companies in charge of building and maintaining roads were also removing all road signs that could be used by invading Russian forces to find their way around. The country. Four days into the full-scale invasion, Google disabled the map's traffic data, incorporating locations and speed information from smartphones with the app, then using it to show in real time how dense traffic conditions are in certain places or how busy those areas are overall.
So Google Maps. Also blocked edits after Ukrainian language accounts claimed that map edits were used to coordinate Russian airstrikes targeting gas stations, schools and hospitals in the cities like Kyiv. The company declines to comment on what prompted the decision or whether it had done something similar for conflicts. The company. The company. The company. The company. The company. The company. The company. The company. The company. The company. The company. The company. The company. So we don't know it's precedental or unprecedented. Or it's just kind of like blocking the information. So in this. So after the invasion, there was a quite interesting situation where everyone who quite used to, you know, orient themselves with the Google Maps, etc. And especially because people had to move from the areas like Kyiv or directly invaded areas to other areas. So I know it's a very interesting situation. I know there was a lot of confusion in terms of how to get from one place to another, even for Ukrainians themselves. So I myself witnessed an interesting situation. I was at that time in Kamianets-Podilsky, it was southwest of Ukraine. And we were helping one family from the Kiev region to get closer to us.
And it was very tricky to actually lead them through cell phone in the situation when all the roadmaps and Google Maps were all down. The deep state map keeps the record of changes, whether it is a corrected error or a verified daily update. A detailed record of the past, it also has a speculative dimension. A feature possibly inherited from the designer's gaming background. As a user, you can activate a drone or destroy an enemy position. And here I need to click on another slide. So, the previous slide was showing how part of the map is visible in terms of data and traffic. This is a traffic. Right? see Ukraine where all traffic absolutely disappears. That's Google. Yeah. And now we are looking at the deep state map and all these possibilities to simulate, right? Okay. So a detailed record of the past. It also has a speculative dimension, a feature possibly inherited from the designer's gaming background. As its user, you can activate a drone and destroy enemy position. Alternatively, it includes a simulation of a nuclear strike at a selected location with a user-specified charge mass, consequences for the population, and international security. So the speculative dimension I find specifically interesting because it's a kind of invitation to think, to imagine, envision the future.
And to conclude, this map serves as a cognitive tool for relating to and understanding the evolution, the evolving situation on the ground, including territorial control, troop movement, and key strategic location. It is the only map that reveals the proximity of the front line in the form of a civilian user. It is also a comprehensive map for a civilian user. I know from my ethnographic research that many users rely on this map for kind of planning their future, for thinking about how, like for basically correlating the information about the movement of the front line to how and what they have planned their future. However, according to moderators, the Ukrainian military may ask them to delay the movement. But the map is not only to keep the enemy from literally posting certain data as long as it's needed to keep secret for confusing the enemy. This is why it is not recommended, in fact, to use the map for civilian road trips, or building escape routes from the occupied territories, or delivering the goods and tech to the soldiers by volunteers. While the map is regarded as the most accurate map of the war in Ukraine, it also embodies the topology of the martial gates, a tool of warfare.
Its accuracy is a matter of negotiation with the military, since this map is also used by the Russian troops. And so that's where I end. And I just want to highlight again with this particularly very interesting kind of feature that, again, drove me to use this project, is precisely the visibility of this map for everyone, right? So how do you create this map so it at the same time provides the most accurate information and confuses the enemy? Visit us www.f Да зар insult www.ilsa зал www.insult Morgan www.larsanatan.com www.inclinicast.com Click the card that says Info Loge